Chapter 4
Everything in Python is an object.
We'll study objects in the context of some simple graphics programming.
In order to run the graphical programs and examples in this chapter (and the
rest of the book), you will need a copy of the file graphics.py that is supplied
with the supplemental materials. Using the graphics library is as easy as placing
a copy of the graphics.py file in the same folder as your graphics program(s).
Alternatively, you can place it in a system directory where other Python libraries
are stored so that it can be used from any folder on the system.
As usual, the best way to start learning new concepts is to roll up your sleeves
and try out some examples. The first step is to import the graphics module.
Assuming you have placed graphics.py in an appropriate place, you can import
the graphics commands into an interactive Python session. If you are using IDLE,
you may have to first "point" IDLE to the folder where you saved graphics . py.
A simple way to do this is to load and run one of your existing programs from
that folder. Then you should be able to import graphics into the shell window:
>>> import graphics
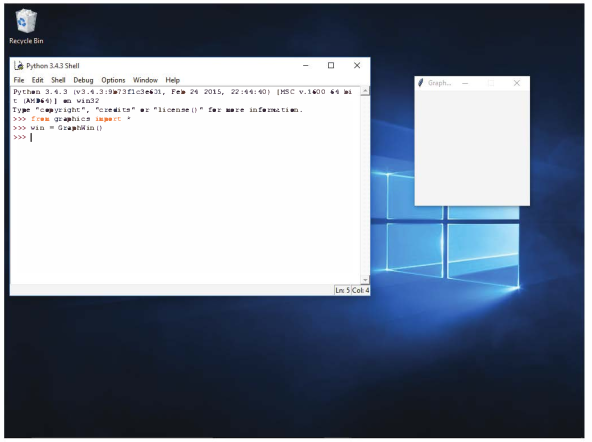
Next we need to create a place on the screen where the graphics will appear.
That place is a graphics window or GraphWin, which is provided by graphics:
>>> win = graphics.GraphWin( )
>>>
The Graph Win() function creates a new window on the screen. The window will have the title "Graphics Window."
The GraphWin is an object, and we have assigned it to the variable called win.
We can now manipulate the window object through this variable. For example,
when we are finished with a window, we can destroy it. This is done by issuing the close command:
#Typing this command causes the window to vanish from the screen.
>>> win.close( )
Screen shot with a Python shell (IDLE) and a GraphWin:
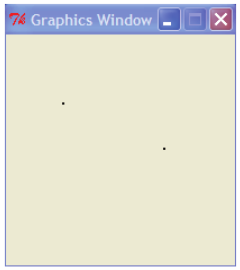
Here is a sample interaction with Python illustrating the use of Points:
>>> p = Point(50,60)
>>> p.get(x)
50
>>> p.get.(y)
60
>>> p.draw (win)
>>> p2 = Point(140,100)
>>> p2.draw(win)
#Graphics window with two points drawn.
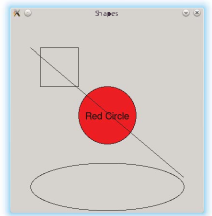
In addition to points, the graphics library contains commands for drawing
lines, circles, rectangles, ovals, polygons and text. Each of these objects is created
and drawn in a similar fashion. Here is a sample interaction to draw various
shapes into a GraphWin:
# Open a graphics window
>>> win= GraphWin('Shapes')
# Draw a red circle centered at point (100,100) with radius 30
>>> center = Point(100,100)
>>> eire = Circle(center, 30)
>>> circ.setFill('red')
>>> circ.draw(win)
# Put a textual label in the center of the circle
>>> label = Text(center, "Red Circle")
>>> label.draw(win)
# Draw a square using a Rectangle object
>>> rect = Rectangle(Point(30,30), Point(70,70))
>>> rect.draw(win)
# Draw a line segment using a Line object
>>>line= Line(Point(20,30), Point(180, 165))
>>> line.draw(win)
# Draw an oval using the Oval object
>>> oval= Oval(Point(20,150), Point(180,199))
>>> oval.draw(win)
Try to figure out what each of these statements does. If you type them in as
shown, the final result will look this: